Fibonacci Retracements: Definition, Working, and Application
Fibonacci retracement is a popular tool among traders, especially those new to the world of Forex and CFD trading. It sounds like a complex term, but it’s actually a straightforward concept once you get the hang of it. In this article, we’ll break down what Fibonacci retracement is, how it’s used in trading, and why it’s such a useful tool for traders, especially those just starting out.
Understanding Fibonacci Retracement: The Basics
To understand Fibonacci retracement, we first need to talk about Leonardo Fibonacci, an Italian mathematician who introduced a sequence of numbers in the 13th century that now bears his name: the Fibonacci sequence. This sequence starts with 0 and 1, and each subsequent number is the sum of the previous two. So, it goes 0, 1, 1, 2, 3, 5, 8, 13, 21, and so forth.
What’s fascinating about this sequence is that it appears in nature quite often – in the arrangement of leaves on a stem, the branching of trees, the flowering of an artichoke, and many other natural phenomena.
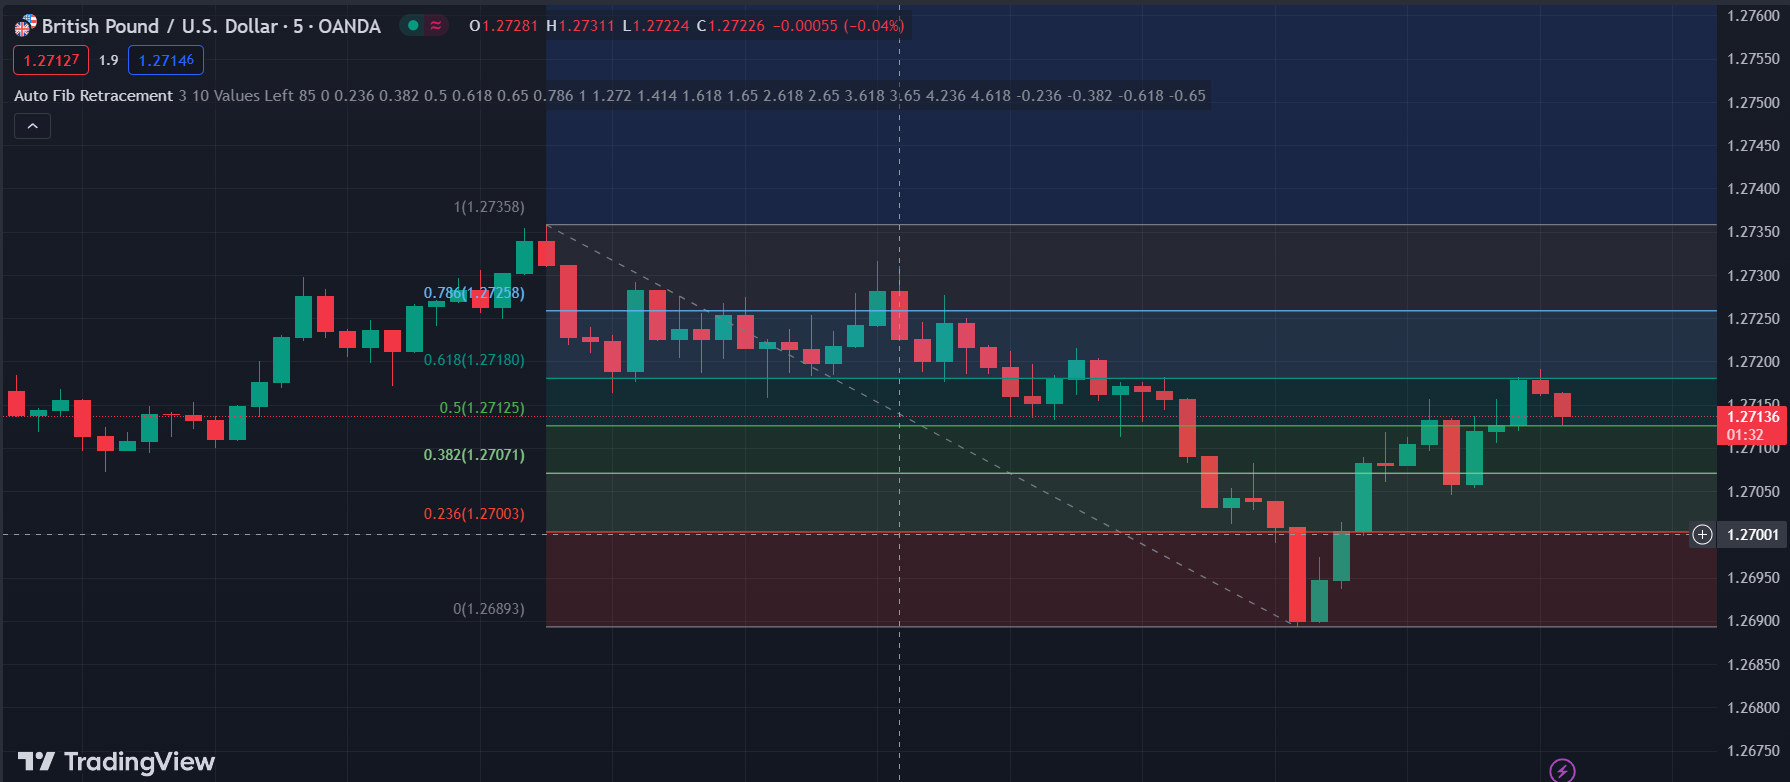
In trading, Fibonacci retracement involves using horizontal lines to indicate areas of support or resistance at the key Fibonacci levels before the price continues in the original direction. These levels are derived from the Fibonacci number sequence. The most common levels used in retracement settings are 23.6%, 38.2%, 50%, 61.8%, and sometimes 76.4%.
How Fibonacci Retracement Works in Trading
Imagine you’re looking at a chart, and you see a stock that’s been going up in price. Suddenly, it starts to fall. As a trader, you’re interested in finding out where the fall might stop and the stock might start going up again. This is where Fibonacci retracement comes in.
By drawing horizontal lines at the Fibonacci levels mentioned above (23.6%, 38.2%, etc.) between the low and high points of the price, traders can predict potential support and resistance levels. This is based on the idea that markets will retrace a predictable portion of a move, after which they will continue to move in the original direction.
Applying Fibonacci Retracement to Your Trading Strategy
Using Fibonacci retracement in trading is relatively simple. Here’s a step-by-step guide:
Identify the Peak and Trough: First, identify the most recent significant high (peak) and low (trough) on your chart.
Draw the Fibonacci Levels: Using your trading software, draw the Fibonacci retracement levels between these two points.
The software will automatically calculate the key Fibonacci levels and draw them as horizontal lines on your chart.
Interpreting the Levels: Now, watch how the price behaves as it reaches these levels. If the price stalls or reverses at one of the levels, this could be a signal to enter a trade.
Using as Support and Resistance: The Fibonacci levels can act as support and resistance lines. If the price is dropping and reaches a Fibonacci level, this level may act as support and cause the price to bounce back up. Conversely, if the price is rising and reaches a Fibonacci level, this level may act as resistance and cause the price to fall back down.
Why Fibonacci Retracement is Useful for Beginners
For beginners, Fibonacci retracement is an excellent tool because:
It’s Simple to Use: Once you understand how to draw the levels, it’s an easy and straightforward tool.
Helps Identify Entry and Exit Points: It can help you figure out good points to enter and exit trades.
Widely Used: It’s a popular tool, which means many traders are watching these levels, potentially increasing their effectiveness.
Tips for Using Fibonacci Retracement Effectively
While Fibonacci retracement is a useful tool, it’s important to use it wisely:
Combine with Other Tools: Don’t rely solely on Fibonacci retracement. Use it in conjunction with other analysis tools and indicators to confirm your findings.
Practice on a Demo Account: Before using it in live trading, practice drawing and interpreting Fibonacci levels on a demo account.
Be Flexible: Remember, these levels are not hard and fast rules. The market may not always react as expected at these levels.
Common Mistakes to Avoid
When using Fibonacci retracement, avoid these common mistakes:
Drawing Levels Incorrectly: Ensure you’re correctly identifying the high and low points for your Fibonacci levels.
Over-reliance: Don’t make the mistake of thinking Fibonacci levels are the only analysis you need. They are just one tool in your trading toolkit.
Conclusion
Fibonacci retracement is a valuable tool for traders, particularly those new to Forex and CFD trading. It helps in identifying potential reversal levels, thereby aiding in decision-making. However, it’s important to use this tool as part of a broader trading strategy, combining it with other technical analysis tools and indicators.
Remember, trading is not just about using the right tools; it’s also about understanding the market, being disciplined, and managing your risks effectively. With practice and patience, Fibonacci retracement can become an integral part of your trading arsenal, helping you make more informed and confident trading decisions.
Frequently Asked Questions on Fibonacci Retracement
Does Fibonacci retracement actually work?
Fibonacci retracement is a technical indicator that helps traders in predicting the price trends of capital markets. It is not certain that the prices move according to the Fibonacci series but experienced traders believe that it works more than 70% of the time.
What is 100% Fibonacci retracement?
The 100% Fibonacci move can either mean an upward or downward rally that goes to the extreme levels of the Fibonacci series. It signals that there is a high probability of a trend reversal.
Which Fibonacci retracement is best?
The most popular Fibonacci retracement levels are 61.8% and 38.2%. However, the preference for the best Fibonacci retracement depends on the trader.