Fibonacci Extensions: The Mathematical Harmony in Trading
In the intricate world of financial markets, Fibonacci Extensions stand out as a fascinating tool, blending mathematics, nature, and economics. Originating from the legendary Fibonacci sequence, these extensions are more than just numbers on a chart; they represent the unseen rhythms of the market. This comprehensive guide aims to unlock the secrets of Fibonacci Extensions, making them accessible to both novice and experienced traders.
The Fibonacci Sequence: A Brief Overview
The Fibonacci sequence is a series of numbers where each subsequent number is the sum of the two preceding ones. This sequence, starting from 0 and 1, progresses as 0, 1, 1, 2, 3, 5, 8, 13, 21, and so on. This sequence is not merely a mathematical phenomenon; it is prevalent in various natural patterns and structures. In the world of trading, this sequence forms the backbone of Fibonacci-based technical analysis tools.
Fibonacci Extensions: Unraveling the Concept
Fibonacci Extensions are advanced tools used by traders to anticipate potential levels of support and resistance beyond the standard Fibonacci retracement levels. These extensions are crucial in determining where the price might potentially head after a significant price movement and subsequent retracement.
How to Plot Fibonacci Extensions
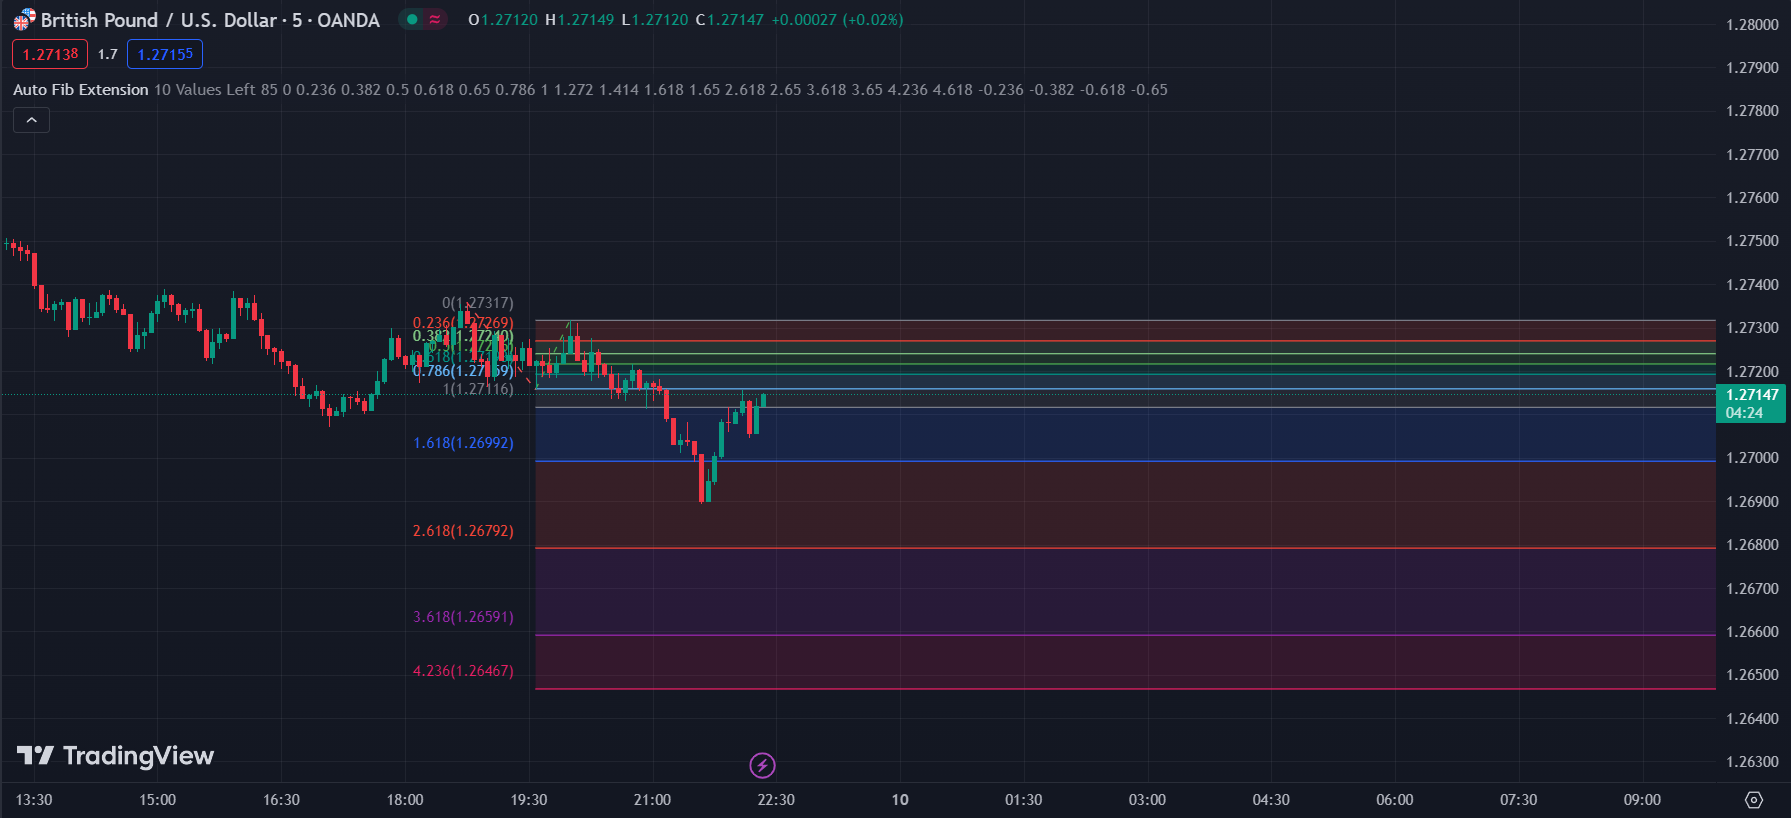
Identifying Significant Price Movements: Select a major high and low on the price chart during a distinct market movement.
Applying the Fibonacci Tool: Draw the Fibonacci lines from the selected low to high (in uptrends) or high to low (in downtrends).
Interpreting the Extensions: The tool projects key Fibonacci ratios beyond the chosen points, indicating potential future price levels.
Essential Fibonacci Ratios
61.8% (Golden Ratio): This level is often closely watched by traders.
100%: Represents the full movement of the initial price swing.
161.8%: A common target in strong trending markets.
Additional levels like 261.8% and 423.6% are also used, especially in highly trending markets.
Practical Use in Trading Strategies
Fibonacci Extensions are versatile tools that can enhance various trading strategies:
Profit Targets: Traders often set take-profit orders near Fibonacci Extension levels.
Entry Points: These levels can signal potential reversal points, offering entry opportunities.
Risk Management: Setting stop-loss orders around these levels can help manage risk.
Combining with Other Analytical Tools
To increase their effectiveness, Fibonacci Extensions should be used in conjunction with other technical analysis tools:
Trend Indicators: Tools like moving averages can confirm the prevailing trend direction.
Momentum Indicators: RSI or MACD can provide additional confirmation for the strength of the trend.
Volume Analysis: High volume levels can reinforce the significance of Fibonacci levels.
Market Context: The Key to Fibonacci Effectiveness
Understanding the market context is crucial when applying Fibonacci Extensions:
Trending vs. Ranging Markets: These tools are most effective in trending markets, where they can provide clear extensions of the trend.
High Volatility Periods: During high volatility, markets may overshoot or undershoot Fibonacci levels, requiring more flexible interpretation.
Advanced Applications: Fibonacci Extensions in Various Markets
Fibonacci Extensions are not limited to a particular market or timeframe:
Stock Market: Used to predict potential targets in individual stocks or indices.
Forex Market: Especially useful in currency pairs exhibiting strong trends.
Cryptocurrency: Can provide insights in the highly volatile crypto markets.
Case Studies and Historical Performance
Analyzing past market scenarios where Fibonacci Extensions have successfully predicted price levels can provide valuable insights. However, it’s important to remember that past performance is not always indicative of future results.
Limitations and Cautions
While Fibonacci Extensions are powerful, they have limitations:
Subjectivity: The selection of high and low points can be subjective.
Self-Fulfilling Nature: Sometimes, these levels work because many traders are watching them.
Complementary Tool: They should not be used as the sole basis for trading decisions.
Risk Management: A Critical Component
Effective use of Fibonacci Extensions requires sound risk management practices:
Stop-Loss Orders: Essential to limit potential losses.
Position Sizing: Adjusting the size of trades based on the confidence level in the Fibonacci setup.
Diversification: Spreading risk across various instruments or setups.
Conclusion
Fibonacci Extensions offer a unique perspective in financial trading, blending the mathematical elegance of the Fibonacci sequence with practical market analysis. By understanding and applying these tools in the context of comprehensive trading strategies and sound risk management, traders can potentially uncover the rhythm in market movements, turning the mathematical harmony of Fibonacci into profitable trading opportunities. Remember, the key is not just in the numbers but in how they are interpreted and integrated into a broader trading framework.
Frequently Asked Questions on Fibonacci Extension
What are Fibonacci extensions used for?
Fibonacci extension is a technical indicator that is used by traders to predict the potential target on the price chart of the capital market. These extensions are also used to identify risk-to-reward ratios in some cases.
What is the best Fibonacci extension?
Some of the most commonly used Fibonacci extensions include 3.6%, 38.2%, 50%, 61.8%, and 78.6%. However, 61.8% and 38.2% are the most popular levels among the traders who use Fibonacci extensions for their analysis.
How do you calculate Fibonacci expansion?
To calculate Fibonacci extensions:
• Identify a significant high and low in a price trend.
• Calculate the difference between these two points.
• Multiply this difference by the key Fibonacci ratios (commonly 1.618, 2.618, and 4.236).
• For an uptrend, add these values to the high point; for a downtrend, subtract them from the low point.
These calculations give you the potential future levels of resistance (in an uptrend) or support (in a downtrend).