Your Guide to Bullish Candlestick Patterns
You may already be familiar with what candlesticks are and how they are used in technical analysis. The main advantage of using candlestick charts is that they can conveniently show the opening, closing, and high, and low prices of a security within a specified time period. Candlestick charts are the most popular form of charts for forex traders.
But there are more uses of a candlestick chart apart from providing such information. A candlestick chart can also be studied to determine whether the security has bullish momentum or bearish momentum.
This momentum can be judged through the pattern which is formed by the chart.
When using chart patterns, remember that they are just one type of indicator and should be used in conjunction with other indicators. Further, there is no guarantee that a chart pattern will work. Lastly, always study the context of the security in question before applying a chart pattern.
In this guide, we’ll take you some of the most popular types of bullish chart patterns which can help you determine whether a currency pair is likely to go up or down.
Reversals vs. Continuations
There are two types of bullish chart patterns. They can be either continuation bullish patterns of reversal bullish patterns.
A continuation bullish pattern means that an uptrend already exists and is likely to continue.
In contrast, a reversal bullish pattern means that a downtrend is likely to convert into an uptrend.
It is essential to study both types of bullish patterns so that you can take advantage of all kinds of trading opportunities.
Bullish Engulfing
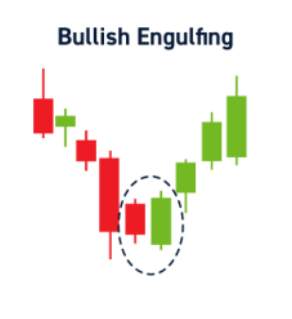
The bullish engulfing pattern is regarded as a reversal bullish pattern. This pattern can materialize when a downtrend is over and an uptrend is about to begin.
It presents itself as a large green candle which is larger than the previous red candle. This pattern shows that the positive momentum of a security has become stronger than the negative momentum.
The bullish engulfing is considered to be a significant price action. It is especially used when the price action occurs at an opportune level. This can be a resistance level or a support level for the security.
For a bullish engulfing pattern to be valid, the security should be experiencing high volumes of trading. Further, it is important that the green candle is larger than the previous red candle.
Hammer and Inverted Hammer
The hammer, as the name suggests, looks like a hammer. It will have a small candle body and a wick of considerable length. When the candle body is present on top of the wick, then it is known as a hammer. When the candle body is present at the bottom of the wick, then it is known as an inverted hammer.
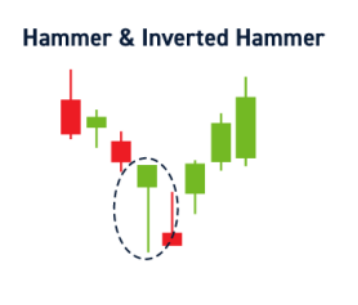
The hammer and the inverted hammer are both considered to be bullish patterns.
This can be understood by studying the reason behind the formation of these two patterns. The hammer is formed when there is a rejection of the selling pressure as buyers enter the market.
In contrast, the inverted hammer presents itself when there is a reduction in the selling pressure and more buyers are entering the market.
Piercing Line
The piercing line can be considered to be a strong indicator of bullish reversal. The piercing line is said to occur when the opening price of the next candle is lower than the closing price of the previous candle. The next candle proceeds to have a closing price which is higher than the halfway point of the previous candle.
While using this pattern, it essential to note the length of the two candles. Both candles should have long bodies. This pattern is more likely to be indicative if it occurs at a key price level such as a support level or a resistance level.
Morning Star
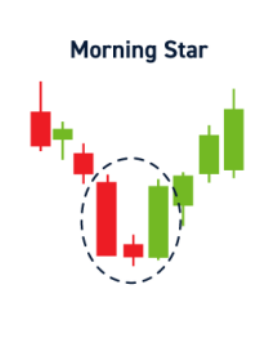
The morning star is a trend reversal bullish pattern.
The first candlestick will be a bearish candle with a fairly large body. This candle denotes that there is significant selling pressure. The next candle will have a small body but will still be bearish. This candle is said to denote that there is still selling pressure but the pressure has reduced. The final candlestick will have a large candle body and will be green. This candle shows that the bullish momentum has overtaken the selling pressure.
Three White Soldiers
The three white soldiers is a continuation bullish pattern.
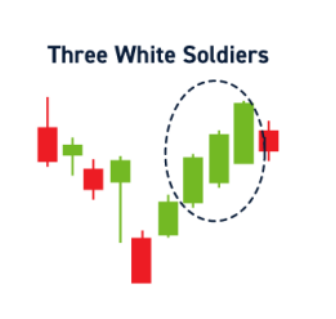
This pattern shows up as three long green candles stuck together. It is important that all three candles have long bodies since this shows that there is considerable bullish momentum. The wicks should be minimal.
Do not assume that the pattern exists until the close of the third candle. Only when all three candles have been formed does the pattern exist.
Wrapping Up
Overall, these bullish candle patterns can help you determine the future direction of securities over the short period. They are especially useful when performing technical analysis using price action. When taken together with other indicators and context, these patterns can be a powerful way of predicting future momentum.
Frequently Asked Questions
Which candlestick pattern is most bullish?
There is no single candlestick pattern that is indicates higher bullishness than others. The five main bullish patterns that you need to know about include the morning star, the bullish engulfing, the three white soldiers, the hammer and the inverted hammer, and the piercing line.
What is the 3 candle rule in trading?
The 3 candle rule in trading refers to the Piercing Line bullish pattern. The Piercing Line consists of three candlesticks which show a strong trend reversal from bearish to bullish.
What is a strong bullish trend?
A strong bullish trend is indicated when one of the main bullish patterns occur. Some of the main bullish patterns include bullish engulfing, morning star, piercing line, hammer and inverted hammer, and three white soldiers.