Your Guide to Bearish Candlestick Patterns
A candlestick pattern is a pattern that shows up in a candlestick chart which can indicate the direction of future price movement of a security. There are two types of candlestick patterns: bearish candlestick patterns and bullish candlestick patterns.
A bearish candlestick can be a continuation pattern which means that the bearish movement of a security is likely to continue. It can also be a reversal pattern which means that the bullish movement of a security is likely to turn into a bearish movement.
In this guide, we’ll be discussing everything you need to know about bearish candlestick patterns.
It is important to note that bearish candlestick patterns should be read with other technical indicators such as volume and resistance to ascertain whether the pattern is likely to be a true indicator of future movement or not.
Bearish Engulfing
The bearish engulfing is considered to be a bearish reversal pattern. It occurs when a green candlestick is followed by a red candlestick which has a longer body than the previous green candlestick. This indicates that the prices are likely to fall from this point onwards.
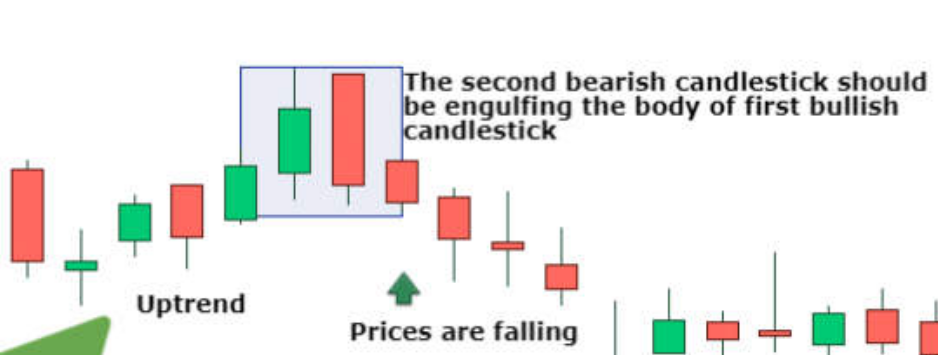
The psychology behind this pattern is that more sellers are moving into the market placing downward pressure on the
security.
The Evening Star
The evening star is another important reversal pattern that shows that an uptrend is likely to turn into a downtrend especially when it occurs at a resistance level.
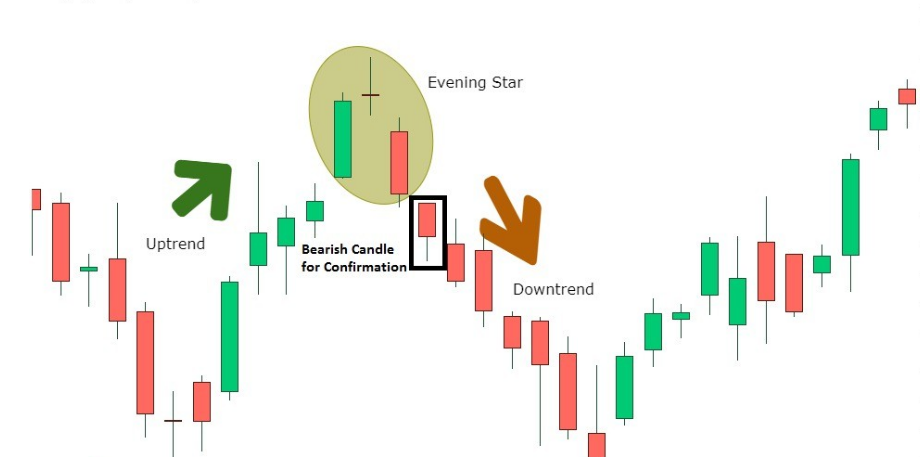
This candlestick pattern consists of three candles. The first candle will have a long body and will be bullish. This is followed by a small body candle which will also be bullish. The final candle will be bearish and will have a long body.
The long body of the final candle shows that the bearish pressure on the candle is strong.
The Three Black Crows
The three black crows is a strong reversal pattern which can mark the end of a bullish run and the beginning of bearish momentum. The three black crows consists of three continuous red candles which all have a long body.
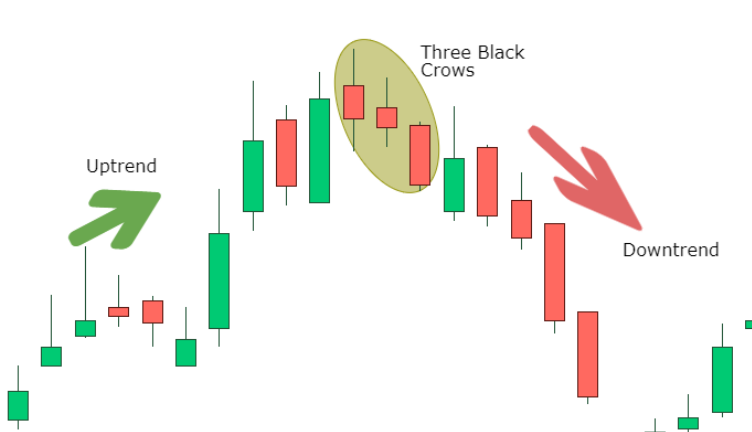
This means that the security’s price has been falling continuously for three consecutive days. It’s important for traders to also check other indicators such as the volume and whether the pattern has occurred at a resistance level.
Hanging Man
The hanging man is a bearish continuation pattern that takes the form of a small red body on top and a long shadow at the bottom, making it look like a hanging man. The hanging man can appear at the top of an uptrend to signal a reversal or it can appear while a bearish movement is already ongoing.
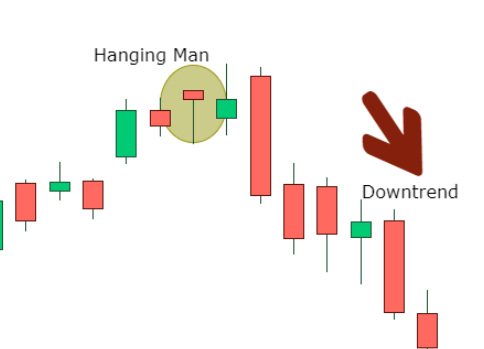
This pattern indicates that bullish forces are trying to push the prices up but the bearish momentum is strong enough for prices to start falling.
The small body indicates that there will be a small difference between the opening and the closing price. However, the long shadow should be at least twice the length of the small body.
Dark Cloud Cover
This is a reversal bullish pattern which can indicate that the bullish momentum is over and a bearish movement is about to start. The candlestick pattern is made up of two candles. The first candle is a bullish candle. The second candle will be a red candle.
The two candles combined show that despite several buyers in the market, the overall trend has become in favor of sellers. After prices have risen, the formation of this pattern shows that the trend is about to reverse.
Wrapping Up
Candlestick patterns are a good way to confirm your belief of a trend reversal or a trend continuation based on other indicators such as support or resistance levels or volume or macro factors. Traders should remember that there is no guarantee that a pattern will hold true.
Frequently Asked Questions
What are bearish candlestick patterns?
A bearish candlestick pattern is a pattern made by candles on a candlestick chart which may indicate that a future bearish movement is likely in the price of a security. There are several different types of bearish candlestick patterns such as evening star, bearish engulfing, and dark cloud cover.
What is the 3 candle rule in trading?
The 3 candle rule in trading usually refers to the three inside up pattern. The three inside up pattern is a bullish reversal pattern.
How can you tell if a candle is bearish?
A candle is bearish if the color of the body of the candle is red. Another way to check if a candle is bearish or not is by ascertaining whether the opening price of a security was lower than the closing price.